
Ocean Carriers CMA CGM and Hapag-Lloyd Post Skyrocketing Third-Quarter Profits on Elevated Freight Rates and Unprecedented Demand

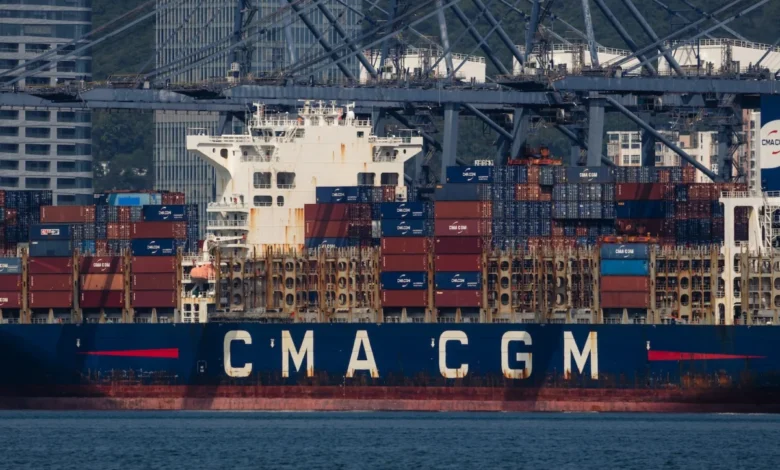
Global ocean container shipping giants CMA CGM and Hapag-Lloyd have reported exponentially higher third-quarter profits, propelled by a dramatic and sustained surge in freight rates throughout the year. The unprecedented financial gains highlight a volatile shipping landscape caught between robust cargo demand, lingering port congestion, and shifting geopolitical and macroeconomic headwinds.
For the third quarter, French ocean carrier CMA CGM saw its net profit more than triple, soaring to $2.32 billion. Concurrently, Germany’s Hapag-Lloyd posted a massive group profit of $999 million, a steep climb from the $172 million recorded during the same period a year earlier. These financial results mirror a broader industry-wide windfall driven by tight vessel capacity and shippers rushing to move goods ahead of potential disruptions and shifting trade policies.
Unexpected Rate Surges Rewrite Carrier Forecasts
The remarkable spike in revenue caught many industry operators off-guard. According to Lars Jensen, CEO of Vespucci Maritime, the aggressive upward revisions issued by major carriers clearly indicate that the industry did not anticipate the magnitude of the rate increases observed.
Following in the footsteps of its Gemini Cooperation alliance partner, Maersk—which upgraded its financial outlook earlier in the month—Hapag-Lloyd raised its full-year guidance for the third consecutive time. The German carrier now projects full-year earnings before interest and taxes (EBIT) to land between $2 billion and $2.4 billion, a substantial increase from its prior projected range of $1.25 billion to $1.75 billion.
CMA CGM opted not to issue specific numerical monetary guidance for the full year, but noted in its operational outlook that the strong volume momentum experienced in recent quarters is expected to persist. However, the French liner acknowledged that the broader macroeconomic outlook remains clouded by uncertainty, even as elevated freight rates continue to provide strong financial support for its business lines.
Volume Trends Reveal Divergent Operational Realities
While both carriers capitalized on high freight rates, their individual container volume metrics moved in opposite directions during the third quarter. CMA CGM outperformed broader market trends, carrying 6.51 million 20-foot equivalent units (TEUs), representing a 5.5 percent year-over-year increase. Global container demand itself expanded by 5.4 percent during the quarter, propelled by an aggressive 8.4 percent spike in September alone. This late-quarter rush pushed trailing 12-month global container volume past the 200 million TEU threshold for the first time in history.
Conversely, Hapag-Lloyd experienced a minor contraction in volume, moving 3.38 million TEUs—a 0.5 percent decline compared to the previous year. Hapag-Lloyd CEO Rolf Habben Jansen attributed the soft volume figures directly to persistent capacity constraints rather than a lack of customer demand. Lingering congestion at major Asian ports, which has plagued supply chains since the summer months, severely restricted the carrier’s available vessel capacity.
During a corporate earnings call, Habben Jansen noted that Hapag-Lloyd’s available capacity remained largely flat year-over-year, placing the carrier at a temporary disadvantage compared to larger competitors who deployed more vessels. Nevertheless, the CEO expressed optimism that volume growth would recover to between 2 percent and 3 percent by the close of the year, aided by an anticipated 5 percent expansion in available capacity next year as ships gradually resume transits through the Suez Canal rather than the extended route around the Cape of Good Hope.
CMA CGM’s volume growth, meanwhile, was anchored by robust corporate inventory restocking, rising global capital investments in artificial intelligence infrastructure and data centers, and an increased volume of green technology shipments and electric vehicles moving across international waters.
Maritime Revenues and the Trajectory of Freight Rates
The financial engine driving both carriers’ success was unmistakably their maritime shipping segments. CMA CGM reported a 37.3 percent surge in maritime revenue, reaching $12.3 billion, with the average revenue per TEU hitting $1,891—a 30 percent jump year-over-year. Hapag-Lloyd experienced a similar trajectory, reporting a 25 percent increase in liner revenue to $6.7 billion, backed by an average freight rate of $1,808 per TEU, marking a 28 percent annual increase.
Despite these astronomical gains, market indicators suggest that spot freight rates on primary trans-Pacific trade lanes reached their apex during September and October before beginning a downward correction in November.
Drewry’s World Container Index illustrated this cooling trend, putting the average spot price to move a 40-foot container from Shanghai to New York at $9,020, representing a 13.5 percent drop from its October 1 peak of $10,428. Similarly, the Shanghai-to-Los Angeles route fell to $7,416 per box, down 7.4 percent from its October 22 peak of $8,007. The composite index itself fell 2 percent to $4,305 per container, driven by softer rates on the Shanghai-to-Rotterdam lane, while routes like Shanghai to Genoa remained relatively steady.
Industry analysts expect trans-Pacific rates to experience further downward pressure due to softening post-peak demand, prompting carriers to proactively manage capacity by increasing blank sailings. Conversely, trade lanes connecting Asia to Europe and the Mediterranean are anticipated to see slight rate increases, supported by implementation of new freight-all-kinds rates and peak-season surcharges introduced in the latter half of November.
Early Peak Season Driven by Regulatory Shifts and Front-Loading
The unprecedented strength of the shipping market in 2026 was largely defined by an unusually early and protracted trans-Pacific peak season. Judah Levine, head of research at Freightos, noted that supply chain front-loading commenced as early as May. This shift was heavily influenced by a more favorable effective tariff regime following the U.S. Supreme Court’s decision to invalidate certain international emergency economic powers duties in February, which led to subsequent tariff refunds for importers.
As cargo owners rushed to secure inventory ahead of potential regulatory and economic disruptions, U.S.-bound ocean imports climbed steadily, peaking just below historical records in September at 2.37 million TEUs, according to data from the National Retail Federation and Hackett Associates.
Strategic M&A Horizon: Hapag-Lloyd and ZIM
Amid shifting market fundamentals, major ocean carriers continue to pursue strategic consolidations. Hapag-Lloyd confirmed that its planned $4.2 billion acquisition of ZIM Integrated Shipping Services remains on track. Despite encountering minor procedural hiccups within the regulatory approval process, Hapag-Lloyd leadership anticipates that the transaction will officially close in the first quarter of 2027, pending final clearance from regulatory authorities in Israel.
Broader Economic Implications
The extraordinary financial performance of ocean shipping leaders in the third quarter underscores the complex dynamics of modern global commerce. While carriers reap the rewards of elevated freight rates and robust container volumes, the underlying drivers—ranging from port congestion and geopolitical routing changes around the Cape of Good Hope to proactive inventory management by retailers—point to a persistently volatile operating environment.
As spot rates begin to normalize from their autumn peaks and carriers prepare for capacity adjustments heading into the new year, the container shipping industry remains a critical barometer for the health of global supply chains. The ability of carriers to balance equipment availability, network efficiency, and fluctuating demand will dictate financial outcomes as the industry transitions into the next fiscal cycle.
Related posts: